
A
函数:Array.concat
Usage
append(x, values, after = length(x))
Arguments 参数
- x
- values
- after
说明
Examples
1 | # NOT RUN { |
函数:Array.every
Usage
1 | as.POSIXct(x, tz = "", …) |
Arguments 参数
- x 用来转换的R对象
tz 如果需要,则进行时区规范化。系统特定(参见时区),但””是当前时区,“GMT”是UTC(世界时,协调)。 在某些带有警告的平台上,无效值通常被视为UTC。
… 要传递给其他方法或从其他方法传递的其他参数
- format 字符串给出
strptime使用的日期时间格式 - tryFormats 如果
fromat未指定,则使用此字符串作为向量进行尝试 - optional 逻辑指示如果格式猜测不成功则返回NA(而不是发出错误信号)
-
- origin
说明
Examples
函数:Array.from()
Usage
1 | Array.from(arrayLike[, mapFn[, thisArg]]) |
Arguments 参数
- arrayLike 想要转换成数组的伪数组对象或可迭代对象。
- mapFn 如果指定了该参数,新数组中的每个元素会执行该回调函数。
- thisArg 可选参数,执行回调函数 mapFn 时 this 对象。
说明
Array.from() 方法从一个类似数组或可迭代对象中创建一个新的,浅拷贝的数组实例。
Examples
函数:Array.filter
Usage
1 | var newArray = arr.filter(callback(element[, index[, array]])[, thisArg]) |
Arguments 参数
- callback 用来处理数组中每个元素的函数
- element 当前被传递给函数的元素
- index 当前元素的下标
- array 元素所在数组
- thisArg 调用函数时,赋给this的值
说明
一个新的、由通过测试的元素组成的数组,如果没有任何数组元素通过测试,则返回空数组。
Examples
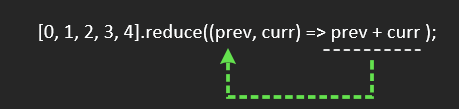
函数:Array.reduce
Usage
1 | arr.reduce(callback(accumulator, currentValue[, index[, array]])[, initialValue]) |
Arguments 参数
- callback 用来处理数组中每个元素的函数
- accumulator 用来存放每次调用所得的处理结果。
- currentValue 当前被传递给函数的元素
- currentIndex 当前元素的下标
- array 元素所在数组
- initialValue 第一次调用函数时,赋给accumulator的值
说明
reduce 会多次调用callback,每次调用传入四个实际参数,上一次返回值、本次数组输入元素、元素索引、数组。传入的第一个参数和map等不同。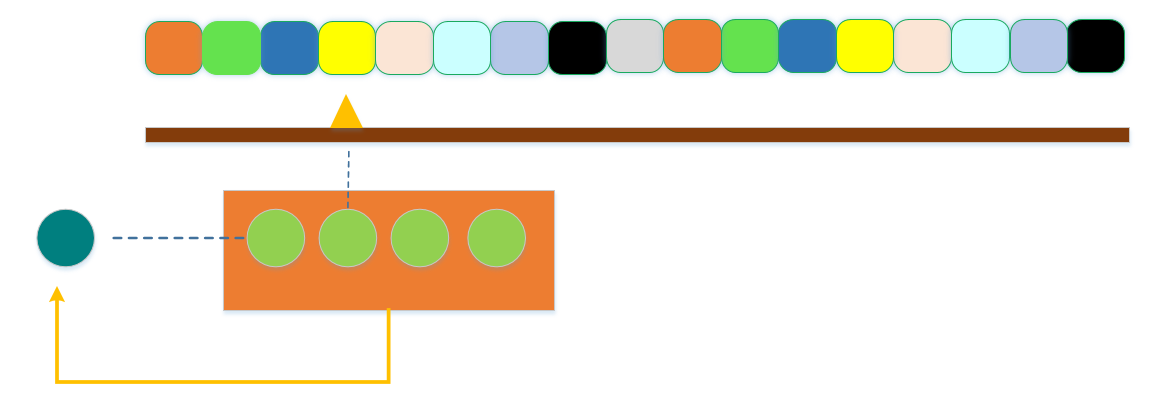
callback永远当函数调用,而不是方法。
Examples
1 | [0, 1, 2, 3, 4].reduce(function(){ |
函数:Array.prototype.shift()
Usage
shift() 方法从数组中删除第一个元素,并返回该元素的值。此方法更改数组的长度。1
arr.shift()
Arguments 参数
- callback 用来处理数组中每个元素的函数
- accumulator 用来存放每次调用所得的处理结果。
- currentValue 当前被传递给函数的元素
- currentIndex 当前元素的下标
- array 元素所在数组
- initialValue 第一次调用函数时,赋给accumulator的值
说明
shift 方法移除索引为 0 的元素(即第一个元素),并返回被移除的元素,其他元素的索引值随之减 1。如果 length 属性的值为 0 (长度为 0),则返回 undefined。
shift 方法并不局限于数组:这个方法能够通过 call 或 apply 方法作用于类似数组的对象上。但是对于没有 length 属性(从0开始的一系列连续的数字属性的最后一个)的对象,调用该方法可能没有任何意义。
Examples
1 | [0, 1, 2, 3, 4].reduce(function(){ |
函数:Array.prototype.slice()
Usage
1 | arr.slice([begin[, end]]) |
Arguments 参数
- begin 用来处理数组中每个元素的函数
end 第一次调用函数时,赋给accumulator的值
说明
slice不会修改原数组,只会返回一个浅复制了原数组中的元素的一个新数组。原数组的元素会按照下述规则拷贝:如果该元素是个对象引用 (不是实际的对象),
slice会拷贝这个对象引用到新的数组里。两个对象引用都引用了同一个对象。如果被引用的对象发生改变,则新的和原来的数组中的这个元素也会发生改变。
如果向两个数组任一中添加了新元素,则另一个不会受到影响。
Examples
B
b1
C
函数:chartr
Usage
chartr(old, new, x)
tolower(x)
toupper(x)
casefold(x, upper = FALSE)
Arguments 参数
- x 字符向量,或者可以通过as.character强制转换为字符的对象。
- old 一个字符串用来指定要转换的字符。 如果提供长度为2或更大的字符向量,则第一个元素将与警告一起使用。
- new 指定翻译的字符串
- upper 累计值,转换为大写还是小写
说明
Examples
1 | > x <- "MiXeD cAsE 123" |
函数:CRS-class
Class “CRS” Of Coordinate Reference System Arguments
PROJ.4 projection system的接口类。
该类被定义为空存根用来接受sp包中的NA值。
如果rgdal包可用,则该类将允许空间数据与坐标参考系统相关联。
必须完全按照PROJ.4文档中的参数输入参数,特别是+
请注意,地理坐标只接受“+proj=longlat +ellps=WGS84”,必须指定(东边,北边); 对于最新版本的PROJ.4库,必须给出(或从给定的“+datum=”值内部扩展)“+ellps=”定义,并且应该设置为适当的值。
Usage
CRS(projargs, doCheckCRSArgs=TRUE)
identicalCRS(x,y)
Arguments 参数
- projargs 字符串类型,表示投影参数;此参数必须完全按照PROJ.4文档输入; 如果投影未知,则使用as.character(NA),它可能会丢失或为零长度的空字符串,然后将设置为缺失值。
- doCheckCRSArgs 默认为TRUE,包开发人员必须将其设置为FALSE,包括S4类定义中的CRS,以避免无法控制地加载rgdal命名空间
- x 具有proj4string方法的对象,或者如果缺少y,则列出具有proj4string方法的对象
- y 类Spatial的对象,或者有proj4string方法的对象
说明
Examples
1 | CRS() |
函数:crs
Usage
1 | st_crs(x, ...) |
Arguments 参数
说明
Examples
函数:cumsum
简介:
返回一个向量,其元素是参数元素的累积和,乘积,最小值或最大值。
Usage
cumsum(x)
cumprod(x)
cummax(x)
cummin(x)
Arguments 参数
- x 数字或复数(不是cummin或cummax)对象,或可以强制转换为其中一种的对象。
说明
Examples
1 | > cumsum(100) |
D
函数:Document.elementFromPoint()
获取视窗中指定位置的元素。
Usage
1 | time1 - time2 |
Arguments 参数
说明
函数:dim
简介:
检测或设置一个对象的维度参数。
Usage
dim(x)
dim(x) <- value
Arguments 参数
- x
一个R对象,比如:矩阵、数组、数据框(data frame) - value
For the default method, either NULL or a numeric vector, which is coerced to integer (by truncation).
对于默认方法,可以是NULL或数值向量,它被强制转换为整数(通过截断)。
说明
维数为value的元素个数,每一维度的长度是value向量对应的分量的值。
比如(3,4,5)向量设置的含义就是,三维,有3行,有4列,有5层,共计60个元素。
Examples
1 | > x <- 1:12 ; dim(x) <- c(3,4) |
结果:
1 | m <- matrix(1:12, 3, 4) |
函数:dist2Line
计算点到线的距离
官网简介
函数:distHaversine
函数:distm
Usage
distm(x, y, fun=distHaversine)
Arguments 参数
- x 点的精度/纬度
- y 同x,如果缺省,则使用x的值
- fun 距离计算函数 distCosine, distHaversine, distVincenty等
说明
http://en.wikipedia.org/wiki/Great_circle_distance
Examples
1 | xy <- rbind(c(0,0),c(90,90),c(10,10),c(-120,-45)) |
函数:dtw
F
函数:fix
简介:
相当于可以调用工具对R对象的值进行修改,调用的工具和对象类型有关。
Usage
fix(x, …)
Arguments 参数
- x
- …
说明
Examples
K
函数:kalmanFilter
函数:Kinhom.Track
Usage
Kinhom.Track(X,timestamp,correction=c(“border”, “bord.modif”,”isotropic”,”translate”),q,sigma=c(“default”,”bw.diggle”,”bw.ppl”,” bw.scott”),…)
Arguments 参数
说明
Examples
L
函数:LCSS
N
函数:names
简介:
查看变量所具有的名称,或给变量修改元素名称
Usage
names(x)
names(x) <- value
Arguments 参数
- x R对象
- value 一个与x长度相同的字符向量,或NULL
官网简介
说明
Examples
1 | z <- list(a = 1, b = "c", c = 1:3) |
函数:Normal 正态
Usage
dnorm(x, mean = 0, sd = 1, log = FALSE)
pnorm(q, mean = 0, sd = 1, lower.tail = TRUE, log.p = FALSE)
qnorm(p, mean = 0, sd = 1, lower.tail = TRUE, log.p = FALSE)
rnorm(n, mean = 0, sd = 1)
Arguments 参数
- x, q vector of quantiles.
- p vector of probabilities.
- n number of observations. If
length(n) > 1, the length is taken to be the number required. - mean vector of means.
- sd
- log, log.p
- lower.tail
说明
Examples
1 | # NOT RUN { |
M
函数:merge
Usage
merge(x, y, …)# S3 method for default
merge(x, y, …)# S3 method for data.frame
merge(x, y, by = intersect(names(x), names(y)),
by.x = by, by.y = by, all = FALSE, all.x = all, all.y = all,
sort = TRUE, suffixes = c(“.x”,”.y”), no.dups = TRUE,
incomparables = NULL, …)
Arguments 参数
- x, y
- by, by.x, by.y
- all
- all.x
- all.y
- sort
- suffixes
- no.dups
- incomparables
- …
说明
Examples
1 | # NOT RUN { |
O
函数:outer
简介:
The outer product of the arrays X and Y is the array A with dimension c(dim(X), dim(Y)) where element A[c(arrayindex.x, arrayindex.y)] = FUN(X[arrayindex.x], Y[arrayindex.y], …).
数组X和Y的外积是数组A,则数组A的维度是c(dim(X), dim(Y))
元素 A[c(arrayindex.x, arrayindex.y)] = FUN(X[arrayindex.x], Y[arrayindex.y], …)
Usage
outer(X, Y, FUN = “*”, …)
X %o% Y
Arguments 参数
- X, Y
- FUN
说明
X %o% Y :
Examples
1 | >test1 <- 1:9 |
P
函数:par
Usage
par(…, no.readonly = FALSE)
(…, = )
Arguments 参数
- …
- no.readonly
说明
Examples
1 | # NOT RUN { |
函数:paste
difference-between-paste-and-paste0
Usage
paste (…, sep = “ “, collapse = NULL)
paste0(…, collapse = NULL)
Arguments 参数
- …
one or more R objects, to be converted to character vectors.
字符向量,用“,”分隔 - sep
a character string to separate the terms. Not NA_character_.
用于分割的字符串 - collapse
an optional character string to separate the results. Not NA_character_.
连接符
说明
会将传入的n个向量进行连接,连接次数以向量中分量最多的向量为准,其它向量则循环使用。
sep用来分隔(连接)分量,collapse用来将连接后的分量进行连接为一个字符串。
比如一个向量为(a,b,c,d),另一个向量为(1,2,3),还有(1)。
则连接次数为4。
(1,2,3)则循环为:1,2,3,1
(1)则循环为:1,1,1,1
如果不设置参数,则为:1
2> paste(c('a','b','c','d'),c(1,2,3),1)
[1] "a 1 1" "b 2 1" "c 3 1" "d 1 1"
如果设置参数,比如sep=‘_’,则:1
2> paste(c('a','b','c','d'),c(1,2,3),1,sep = '_')
[1] "a_1_1" "b_2_1" "c_3_1" "d_1_1"
如果设置参数,比如sep=‘_’,collapse=’&’则:1
2> paste(c('a','b','c','d'),c(1,2,3),1,sep = '_',collapse='&')
[1] "a_1_1&b_2_1&c_3_1&d_1_1"
Examples
1 | > paste('one',2,'three',4,'five') |
函数:plot
画图函数
Usage
plot(x, y, …)
Arguments 参数
x plot中点的坐标。或者,任何可以提供单个绘图结构,函数或具有绘图方法的R对象。
y plot中点的y坐标,如果x是合适的结构(比如包含了完善的位置信息),则可以没有y。
… 传递给方法的参数,比如 graphical parameters (see
par)。许多方法接受以下参数:type plot应该画什么类型的图形,可能是以下图形中的一种:
"p"点"l"线"b"for both,"c"for the lines part alone of"b","o"for both ‘overplotted’,"h"直方图 like (or ‘high-density’) vertical lines,"s"阶梯图"S"for other steps, see ‘Details’ below,"n"for no plotting.
main画出的图的标题: seetitle.sub子标题: seetitle.xlabx轴标题: seetitle.ylaby轴标题: seetitle.aspy / x纵横比, seeplot.window.
说明
Examples
1 | # NOT RUN { |
Q
函数:q1
Usage
rep(x, …)
rep.int(x, times)
rep_len(x, length.out)
Arguments 参数
- x
a vector (of any mode including a list) or a factor or (for rep only) a POSIXct or POSIXlt or Date object; or an S4 object containing such an object. - …
further arguments to be passed to or from other methods. For the internal default method these can include:
times
an integer-valued vector giving the (non-negative) number of times to repeat each element if of length length(x), or to repeat the whole vector if of length 1. Negative or NA values are an error. A double vector is accepted, other inputs being coerced to an integer or double vector.
length.out
non-negative integer. The desired length of the output vector. Other inputs will be coerced to a double vector and the first element taken. Ignored if NA or invalid.
each
non-negative integer. Each element of x is repeated each times. Other inputs will be coerced to an integer or double vector and the first element taken. Treated as 1 if NA or invalid. - times, length.out
see … above
说明
Examples
R
函数:rep
Usage
rep(x, …)
rep.int(x, times)
rep_len(x, length.out)
Arguments 参数
- x
- …
times:each处理后的重复次数
len:总分量个数
each:每个重复多少次 - times, length.out
说明
依次把值赋值给 times -> len -> each
作用的优先级是 len > times > each
即先each生成一个向量,然后times处理后生成一个向量,最后len处理得到最终的向量
Examples
1 | rep(2:5, 2) |
函数:rnorm
Usage
rnorm.acomp(n,mean,var)
rnorm.rcomp(n,mean,var)
rnorm.aplus(n,mean,var)
rnorm.rplus(n,mean,var)
rnorm.rmult(n,mean,var)
rnorm.ccomp(n,mean,var,lambda)
dnorm.acomp(x,mean,var)
dnorm.aplus(x,mean,var)
dnorm.rmult(x,mean,var)
Arguments 参数
n 要模拟的数据集数量
mean 要模拟的数据集的平均值
var 方差协方差矩阵
lambda 预计总数
x 采样空间中的向量
说明
Examples
1 | # NOT RUN { |
S
函数:sample
Usage
sample(x, size, replace = FALSE, prob = NULL)
sample.int(n, size = n, replace = FALSE, prob = NULL,
useHash = (!replace && is.null(prob) && size <= 2=”” n=”” &&=””> 1e7))
Arguments 参数
- x :提供的采样范围、训练集
- n :最终需要
- size :总计需要抽取多少个样本
- replace :是否放回,如果是,则抽出的结果可能有重复的,反之,则没有
- prob :概率
- useHash :
说明
Examples
1 | # NOT RUN { |
函数:scale
Usage
scale(x, center = TRUE, scale = TRUE)
Arguments 参数
- x 数字矩阵
- center 长度等于x的列数的逻辑值或类似数字的向量,其中’numeric-alike’表示如果is.numeric()不为true,即不为数字,则as.numeric()将应用,即强制转换为数字。
- scale 长度等于x的列数的逻辑值或类似数字的向量
说明
在我们做数据的时候,一个数据会有很多特征;比如在描述影响房价的因素,有房子面积,房间数量等。而不同的特征存在不同的量纲,为了消除量纲、数值差异等,我们就需要对数据进行中心化和标准化;
那什么是中心化,什么是标准化呢?
所谓中心化就是将数据减去均值后得到的,比如有一组数据(1,2,3,4,5,6,7),它的均值是4,中心化后的数据为(-3,-2,-1,0,1,2,3)
而标准化则是在中心化后的数据基础上再除以数据的标准差
在R语言中可以通过scale函数直接进行数据的中心化和标准化,具体如下:
Scale(x,center,scale)
参数解释:x—即需要标准化的数据
center—表示是否进行中心化
scale—表示是否进行标准化
1、数据的中心化
所谓数据的中心化是指数据集中的各项数据减去数据集的均值。
例如有数据集1, 2, 3, 6, 3,其均值为3
那么中心化之后的数据集为1-3,2-3,3-3,6-3,3-3,即:-2,-1,0,3,0
2、数据的标准化
所谓数据的标准化是指中心化之后的数据在除以数据集的标准差,即数据集中的各项数据减去数据集的均值再除以数据集的标准差。
例如有数据集1, 2, 3, 6, 3,其均值为3,其标准差为1.87
那么标准化之后的数据集为(1-3)/1.87,(2-3)/1.87,(3-3)/1.87,(6-3)/1.87,(3-3)/1.87,即:-1.069,-0.535,0,1.604,0
Examples
函数:seq
函数:sink
说明
Examples
简介:
sink将R的输出转移到连接(并在之后使用sink停止这种转移)
sink.number() 显示有多少个正在使用的连接数
sink.number(type = “message”) 报告当前用于错误消息的连接数
Usage
sink(file = NULL, append = FALSE, type = c(“output”, “message”),split = FALSE)
sink.number(type = c(“output”, “message”))
Arguments 参数
- file a writable connection or a character string naming the file to write to, or NULL to stop sink-ing.
一个可写的连接或要写入的文件的文件名或NULL(用来停止sink) - append
值为TRUE/FALSE,如果为TRUE,输出会追加到文件;否则,重写文件,不保留之前的内容(如果有的话) - type
字符串类型,输出流或消息流,名称将部分匹配,因此可以缩写。 - split
值为TRUE/FALSE,如果为TRUE,输出将被发送到新的sink和当前的输出流,就像Unix程序tee一样。
说明
Examples
1 | # NOT RUN { |
函数: stplot
Usage
Arguments 参数
说明
Examples
T
函数:tracks
Usage
Arguments 参数
说明
Examples
U
函数:unlist
Usage
unlist(x, recursive = TRUE, use.names = TRUE)
Arguments 参数
- x R对象,通常是列表或向量
- recursive 逻辑值 是否应该将非列表化应用于x的列表组件
- use.names 逻辑值 名字是否保留
说明
Examples
1 | # NOT RUN { |